To generate this report, start the Auditor Knowledge Builder and open the project. Use Tools | Watched Attributes report, then click the Generate report button. The report will take about 5 minutes to generate depending on the number of data entry requests at your site, and the performance of the Auditor Server computer at your site. A dialog will show in the Knowledge Builder once the report has been generated.
The report is formatted as an Excel spreadsheet consisting of three sheets. Each sheet gives its data per month.
The Comments sheet
This sheet can help you determine the effectiveness of each comment (i.e. error flag).
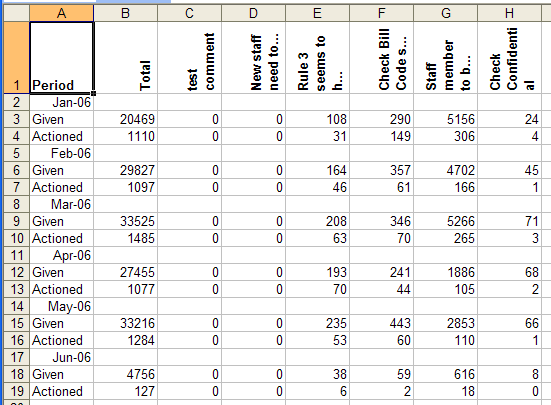
Looking at cell E9 shows you that the comment “Rule 3 seems to h…” was given 208 times in March 2006. The next cell down shows that on 63 occasions, this comment was given in a case that was actioned, i.e. contained an error. This indicates that this error flag was very effective.
However, some comments seem to become less effective over time. The following comment was initially actioned 30 times, but far less often in subsequent months.
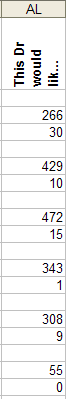
This could be for several reasons:
- the autovalidation rate for this comment is too high, so it is no longer being seen, or
- The workflow issue that this comment highlighted is no longer a problem (possibly because the data entry operators have become better trained), or
- The operators reviewing the comment have become used to it and are not careful about checking it any more. This might be because it had too many false positives and needs further rules to stop it being given in these situations.
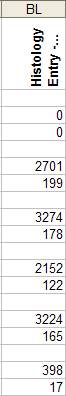
Some comments, as shown in the example below, have a high false positive rate as indicated by being given many times but actioned relatively few times. If possible, these comments need “tightening up” by rules to reduce the number of requests that are flagged and so need to be reviewed.:
The Actions Sheet
This shows, per month, the number of cases getting each action:
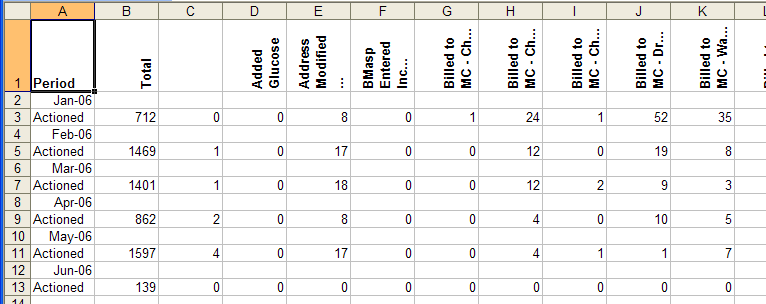
For example, by looking at cell J3, you can see that the action “Billed to MC- Dr…” was taken for 52 cases in January 2006. This action has not been taken so often recently. It might be worth finding out why, as it presumably has some impact on laboratory revenue.
Watched Attributes
Data on specific attributes may also be obtained. You must ensure a “watch” has been set against these attributes. From the Tools menu select Watched attributes. The currently available attributes will appear in the Watched attribute pane. Use the Add button to include extra attributes.
For example: By setting RequestEnteredBy as a watched attribute in the DataEntry project, there is a sheet for it in the spreadsheet report. This sheet therefore allows you to target your operator training.
The sheet records for each month:
- the number of cases entered by each operator, and
- the number of cases actioned, and
- the actions taken.
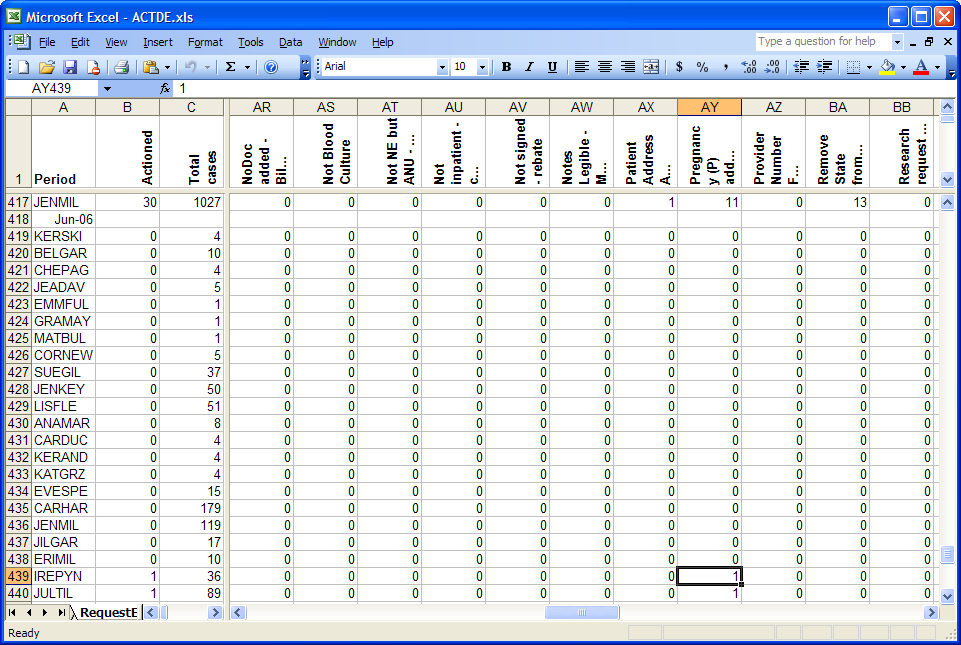
In the example above, row 418 tells us that the next block of entries are for June 2006. Row 439 shows that the operator IREPYN entered 36 cases in this period. Only one case had an error. Cell AY in this row shows that the error was in recognising that a pregnancy flag needed to be set.
By setting other watched attributes, you can get statistics of other types of data entry comments or errors, e.g. per financial site.