RippleDown has a Simulation tool that enables you to analyse the interpretations of all cases in any one of the cases lists, such as the Archive or Cornerstone list.
Select the list you want to analyse, then use the menu Tools | Simulation Report. After a short time, a dialog will appear that contains the following statistics:
- A summary statistic showing the number of cases that have an interpretation (that is, a non-empty report)
- A set of detailed statistics for each:
- Feature
- Derived Feature
- Comment
- Report Section
- Autovalidation setting
- Review Queue
- Report
The detailed statistics are arranged in a set of tables, with each table containing the particular item (e.g. Feature) and the associated count (i.e. the number of cases giving that Feature). You can sort the information in each table by clicking on the column heading.
An example of the Simulation report run on the Cornerstone case list and sorted by the “Count” column is shown below:
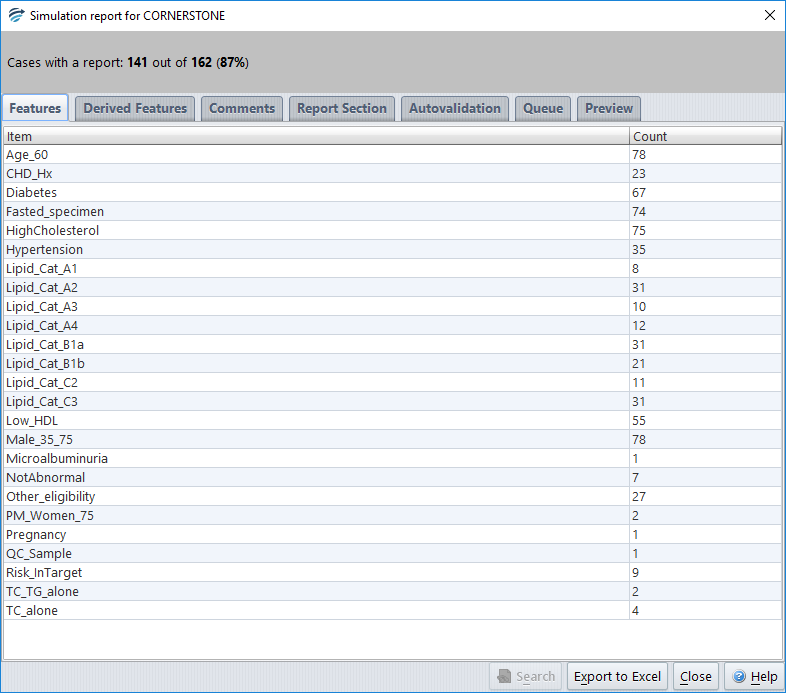
If you select any item from one of the tables (e.g. a Feature), then the Search button becomes enabled, allowing you to search for cases that give this particular item. You can search any case list for the specified item, not just the list used for the Simulation Report. The results of the search will go into the Search list on the main screen. You are able to access the main screen even while the Simulation Report dialog is showing.
There is also an Export button which enables you to export the Simulation Report to an Excel spreadsheet for further analysis.