RippleDown Auditor is the RippleDown (TM) component used to check cases that have been flagged by RippleDown as likely to be having data entry errors. The cases are presented to staff for review and corrective action taken (for cases that really do have errors) in the Online Information System. The types and frequencies of errors are logged in the Auditor and various statistical reports on the type of errors detected are available.
How RippleDown Auditor system works
When a request form enters the laboratory, the details are entered into the Online Information System. The completion of this data entry process triggers the case, which consists of the details just entered plus details of earlier episodes for this patient, to be sent to the RippleDown server.
The RippleDown server passes the case through sets of rules that have been built (by senior data entry operators or PKS) using the Auditor Knowledge Manager. These rules attach comments (or warning flags) to cases that have a high probability of having data entry or other errors. Such flagged cases are queued up to be reviewed using the Data Entry Auditor.
Cases that are viewed in the Auditor show the data entry details for the current and previous episodes and the attention flags that have been added by the rules. If these flags really do indicate problems with the case, these are to be fixed in the Online Information System. The corrective actions taken are recorded for each case, using
the Auditor. Various reports about the errors found are available.
In summary:
- cases are sent to RippleDown at the completion of Data Entry
- rules add flags to cases that are likely to have an error
- flagged cases are reviewed in the Auditor
- corrections to these cases are made in the Online Information System and recorded in the Auditor
- various reports are available from the auditor about the errors detected.
The Auditor Main Screen
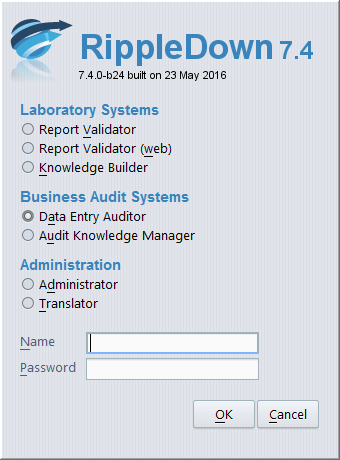
To open RippleDown Auditor, select ‘Data Entry Auditor’ from the RippleDown application menu:
The main screen will then appear, presenting you with a table of queues from which you can review cases:
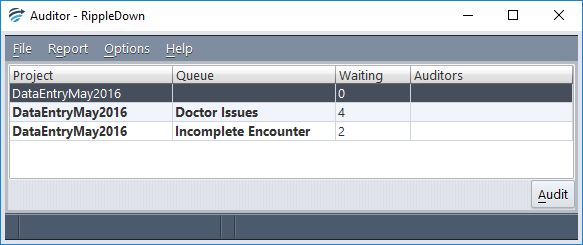
The main screen will show the queues which have cases to be reviewed, and how many cases are in each queue. It also shows the other Auditor users who are currently logged in to the application. Note: More than one person may be reviewing cases in a single queue- cases are allocated in blocks to ensure no duplication of work.
The Case Viewer
A queue can be selected by double-clicking it with the mouse, or by using the arrow keys to highlight it and then activating the ‘Audit’ button.
This will then bring up a frame called the Case Viewer. After a second or two, a case will appear in the Case Viewer like this:
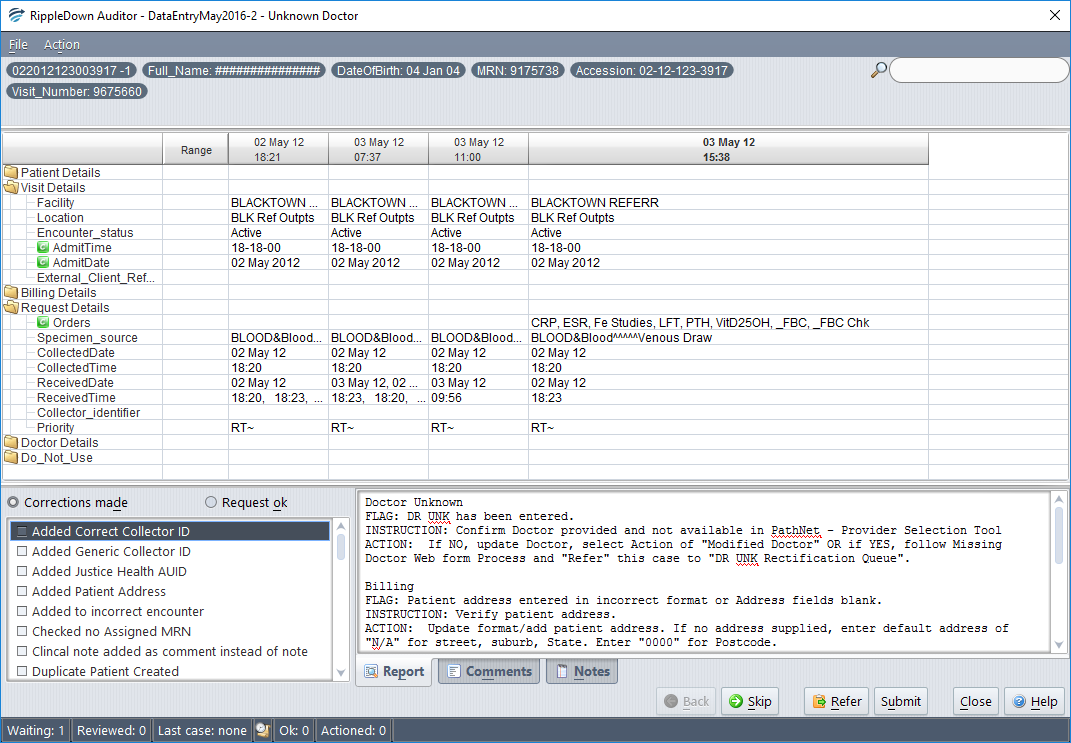
The main regions of this screen are:
The case number
This is in the top left hand corner and is the episode or lab number sent by the Online Information System. RippleDown puts this value into the system clipboard so that it can be pasted into the user interface for the Online Information System, which makes viewing request form images and so on easier. (See the tutorial ‘Handling a case that has two errors’ for more details.)
The case header

The case header typically shows patient demographics such as the medical record number, sex, date of birth, and so on. What is shown here is configured using the Auditor Knowledge Manager. See the tutorial ‘Customising the case view’ for more details.
The time-varying patient data
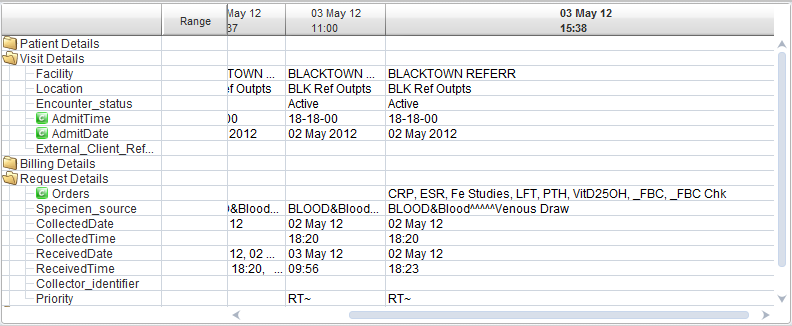
This shows, on the left, the fields from the Online Information System for which values are sent to RippleDown. These values are arranged in columns, each of which represents a particular episode for this patient. The most recent episode is shown as the fattest, right-most column. Note that the scrollbars must be used to see all of the data in the case.
The names of the fields, their order, and which ones are highlighted, can be customised. See the tutorial ‘Customising the case view’ for practice at this.
The comments
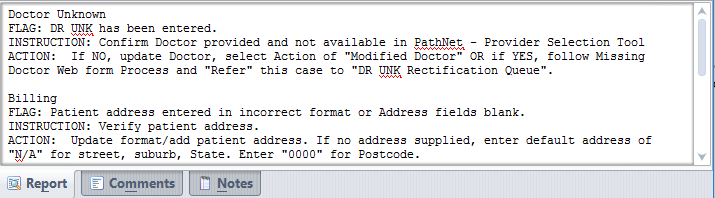
The comments alert you to the things that you will need to pay particular attention to when you look at this case. In the example above, the first comment says that this case has been chosen as part of a random audit, so checking all of the entries against the request form would be advisable. The second comment points out a more specific problem.
The action panel and toolbar
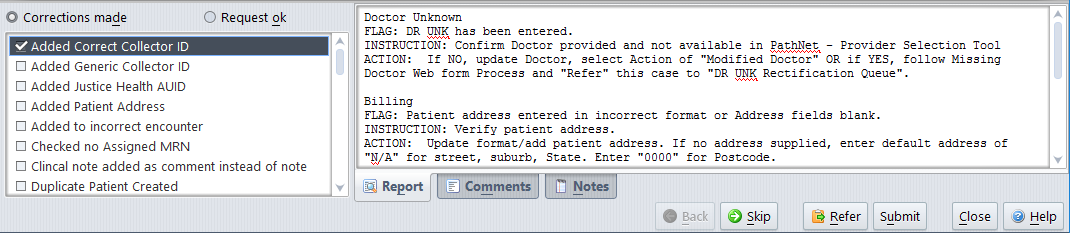
Having looked at a case in the Case Viewer and also in the Online Information System, several different paths can be taken.
The default settings are that corrective action is required so the ‘Corrections made’ radio button will already be selected. If there were in fact no problems with the case and no corrections were made, activate the ‘Request ok’ radio button above the action panel to indicate this, click ‘Submit” on the tool bar. The case will be deleted from the system and the next case shown.
If some corrections were made, activate the ‘Corrections made’ radio button above the action panel. You will then need to select the appropriate action(s) taken from the action panel- the ‘Submit’ button will not become available until at least one action tick box is selected. Once the appropriate actions have been selected, click ‘Submit” on the tool bar. The case will be deleted from the system and the next case shown.
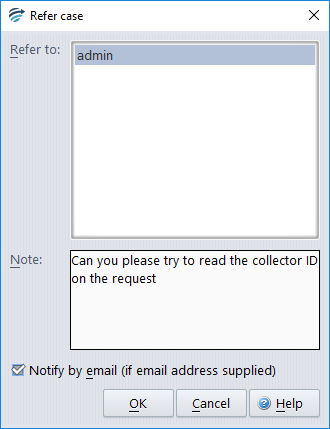
If you feel that there are possible errors in the case that somebody else needs to look at, activate the ‘Refer’ button. This will send the case to another selected users queue, with a note saying why you referred it, you can elect to send the recipient an alert email to inform them.
If you want this case to be looked at later (perhaps the request form has not yet been scanned in) activate the ‘Skip’ button. The next case will show and the current case will be available next time a user reviews this queue.
The ‘Close’ button will take you back to the list of review queues.
Sending cases back to the Knowledge Manager
Sometimes when you are reviewing a case, you might realise that cases like it are never in error. You can send such a case back to the Knowledge Manager so that rules can be built to exclude cases like it from audit. Providing this kind of feedback helps the rule builders to ensure that only the cases most likely to be in error are actually
presented for review. That is, the number of ‘false positives’ can be reduced. See the tutorial ‘Handling a case that should not have been flagged’ for practise at this.
Reports
The main screen has a ‘Reports’ menu from which you can select a variety of different statistics on the errors that have been found. These statistics will be shown in a window that shows up a few seconds after choosing a report from the menu.
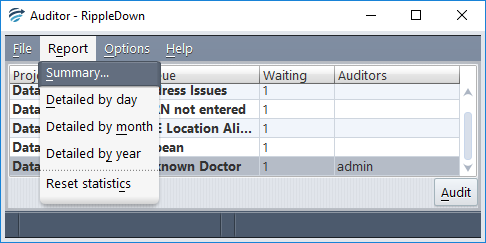
The ‘Summary’ report has three sections. The first shows the overall statistics for the project.From this you can work out the percentage of cases that have errors found in them, the percentage of flagged cases that actually have errors, and so on.
The next section shows the number of errors, per corrective action taken:
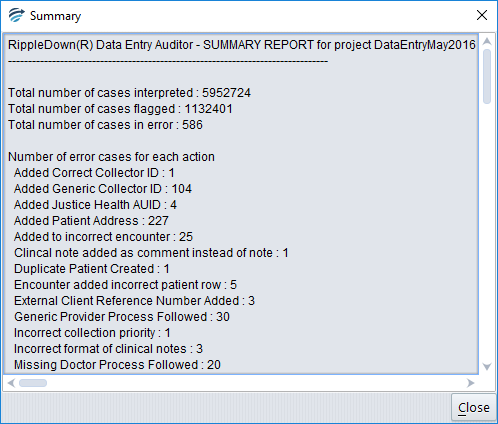
This gives an idea of the frequency with which particular errors occur and can help with the elimination of systemic errors.
Finally, the number of times that each comment has actually flagged an error is given:
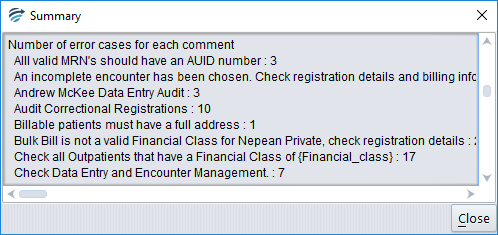
The detailed reports show the same data but on a per day, month, or year basis. These detailed reports can be exported as Excel spreadsheets for incorporation into other reports or for further analysis. See the tutorial ‘Auditor reports’ for practise and more information.