A chart item is type of report item which is represented in the final report as a chart. Consider this block of data:
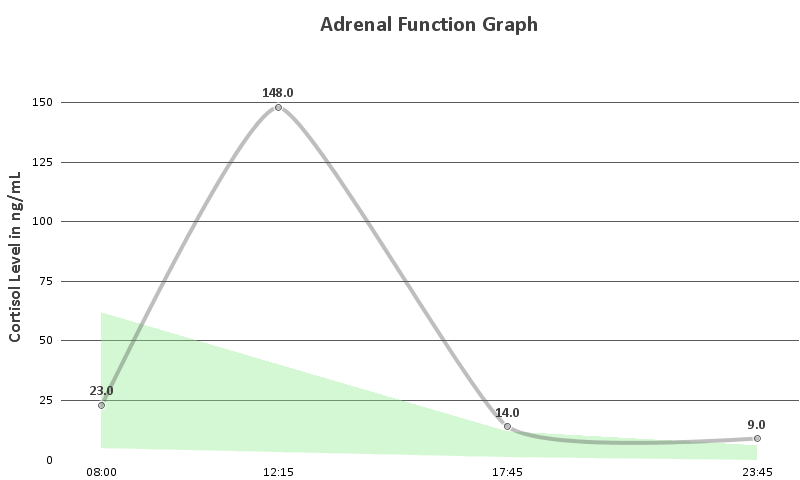
Test Value High Low MorningCortisol23.062.05.0MiddayCortisol148.040.03.0EveningCortisol14.012.01.0MidnightCortisol9.06.00.0
The result of defining a chart with the attributes above would be the following:
Editing a chart report item
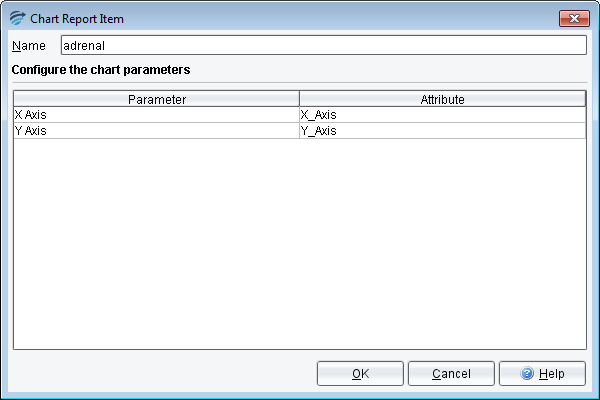
- From the Report Items dialog, click the New Chart Item button
- Type a name for the report item
- Select Group Attributes for the X and Y axes.
Using Group Attributes
You need to use a group attribute for the X and the Y axis. The size of both group attributes has to match.
The order on which the attributes are defined in the group attribute is not important. Instead, the chart will use the order defined in the Attribute Editor.
For instance, consider a case with the following attributes:
Test Value MorningCortisol23.0MorningCortisolTime08:00MiddayCortisol148.0MiddayCortisolTime12:15EveningCortisol14.0EveningCortisolTime17:25MidnightCortisol9.0MidnightCortisolTime23:45
Two Group Attributes are created:
X_AxisMorningCortisolTime (08:00), MiddayCortisolTime (12:00), EveningCortisolTime (20:00) and
MidnightCortisolTime (23:55)Y_AxisMorningCortisol (23.0), MiddayCortisol (148.0), EveningCortisol (14.0) and MidnightCortisol
(9.0)
Now you can use X_Axis and Y_Axis as data providers in the Chart Item:
See also: